Academy Sports (ASO): A Value Investor’s Playbook
Why ASO’s lower valuation, disciplined execution, and growth potential make it a standout in sporting goods retail.

Introduction
In the dynamic world of sporting goods retail, two major players stand out: Academy Sports + Outdoors (ASO) and Dick’s Sporting Goods (DKS). Both companies cater to a wide audience of consumers seeking quality products for outdoor recreation, fitness, and team sports. Yet, while they share the same industry, their strategies, market positioning, and financial performance tell two very different stories.
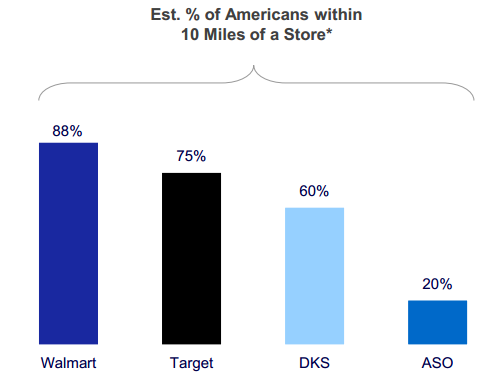
Academy Sports, with its regional coverage and value-oriented approach, trades at a notably lower valuation than Dick’s Sporting Goods, a difference further emphasized by their national store footprint maps (see image gallery below). This disparity highlights a unique investment opportunity, especially given ASO’s untapped growth potential and strong financial metrics. In contrast, DKS leverages its nationwide presence, strategic partnerships, and innovative offerings to maintain a steady growth trajectory, positioning itself as a leader in the space.


This article delves into a detailed comparison of ASO and DKS, examining their financial performance, operational efficiencies, growth potential, and strategic initiatives. For investors, understanding these distinctions is key to identifying which of these retail giants may hold the greater promise for long-term returns.
Valuation
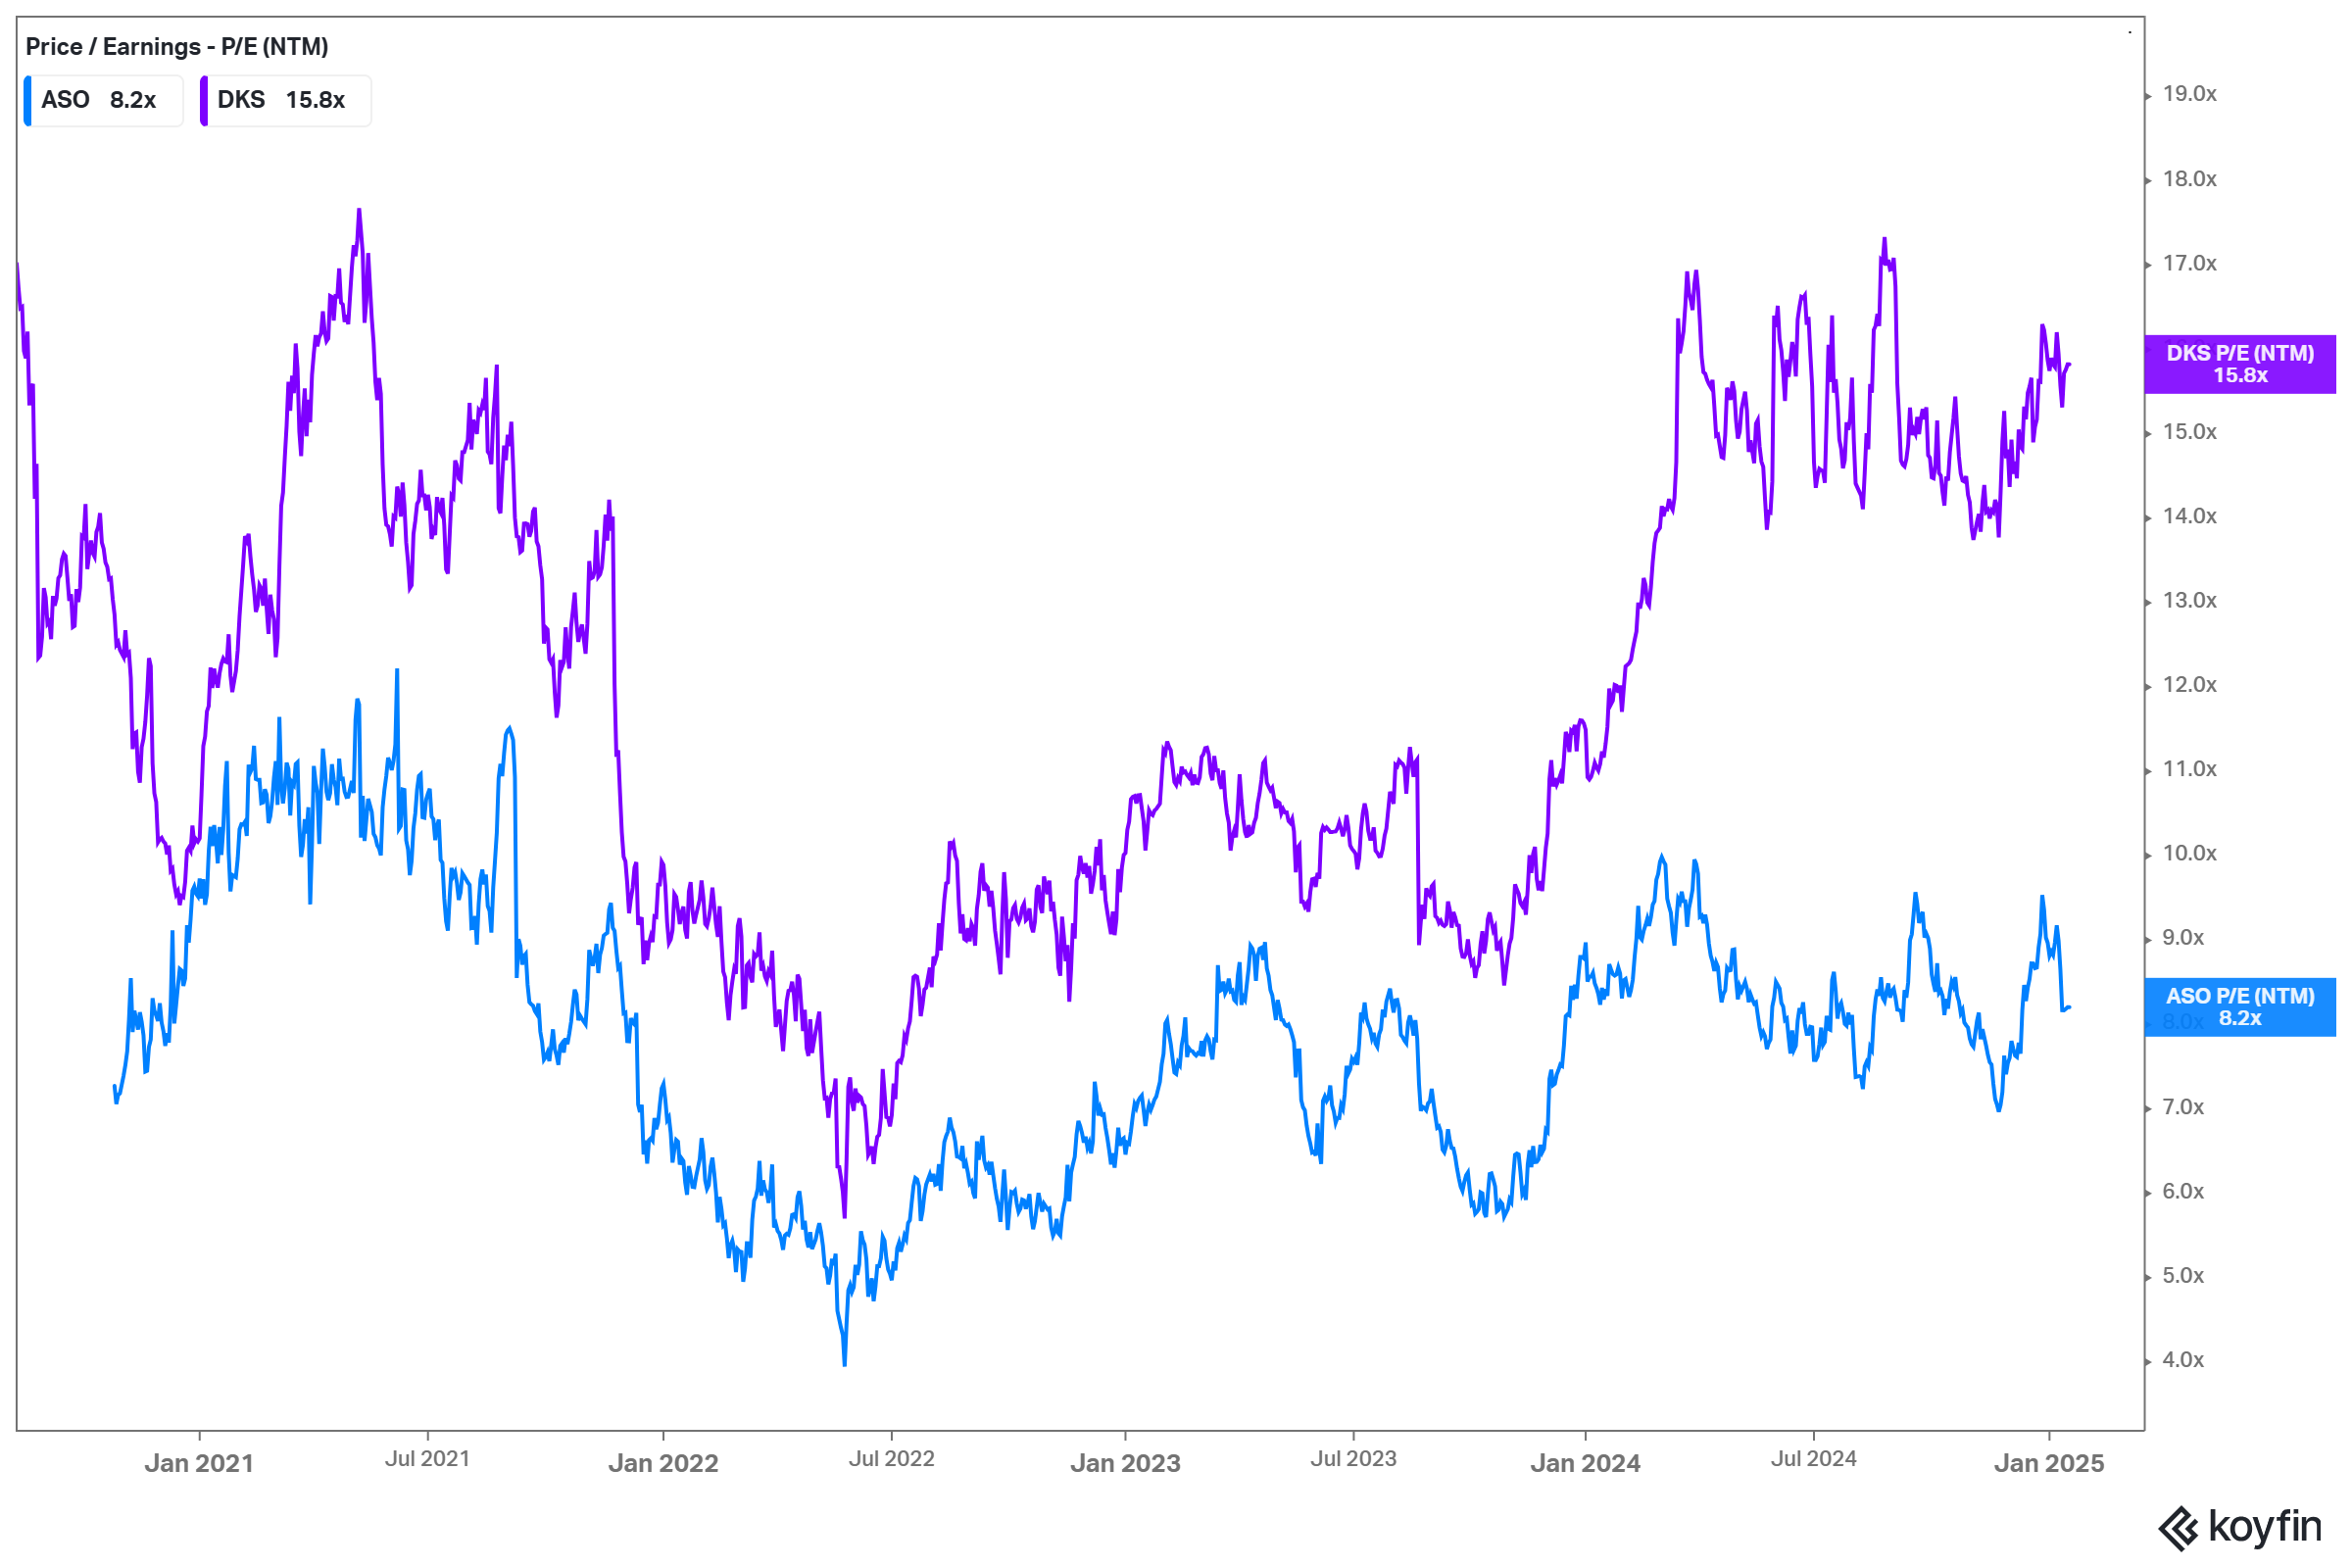
When it comes to valuation, the disparity between Academy Sports + Outdoors (ASO) and Dick’s Sporting Goods (DKS) is striking. Over the last four years, ASO has consistently traded at a discount to DKS, but the current difference is particularly notable. ASO now trades at approximately 50% of DKS’s NTM (Next Twelve Months) P/E ratio—a larger difference than the historical average discount of 30–40%. This raises the question: is ASO undervalued, or is DKS overvalued?
As of the latest data, ASO’s NTM P/E hovers around 8x, while DKS trades at approximately 16x. This pricing discrepancy suggests that the market undervalues ASO despite its strong operational metrics and significant growth potential. For value-conscious investors, this difference presents a compelling opportunity, especially considering ASO’s ability to deliver high ROIC on new stores and robust free cash flow.
Several factors may explain the divergence in valuation:
Perceived Stability: DKS benefits from its larger scale, nationwide footprint, and strong partnerships, which may give investors a sense of stability and justify its premium valuation.
Growth Expectations: Despite ASO’s higher analyst-estimated growth rates, its smaller footprint and recent negative sales comps might create a perception of higher risk.
Market Sentiment: As a more regionally focused retailer, ASO may not command the same level of investor attention as DKS, which operates over three times as many stores.
However, this lower multiple works to ASO’s advantage. It allows the company to repurchase shares at a highly accretive rate, compounding shareholder value more effectively. Additionally, as ASO continues to expand its geographic footprint and drive omnichannel sales, there is potential for a re-rating of its valuation in line with peers.
The chart below illustrates a clear trend: ASO’s valuation remains disconnected from its underlying fundamentals, making it an attractive option for long-term investors seeking both value and growth.
Sales Performance and Operational Metrics
Sales performance and operational efficiency are critical for understanding the strengths and weaknesses of Academy Sports + Outdoors (ASO) and Dick’s Sporting Goods (DKS). Analyzing their comparable sales (% YoY change) since 2019, including the newly added 2024 YTD data, provides a clearer picture of their trends.
Comparable Sales Trends
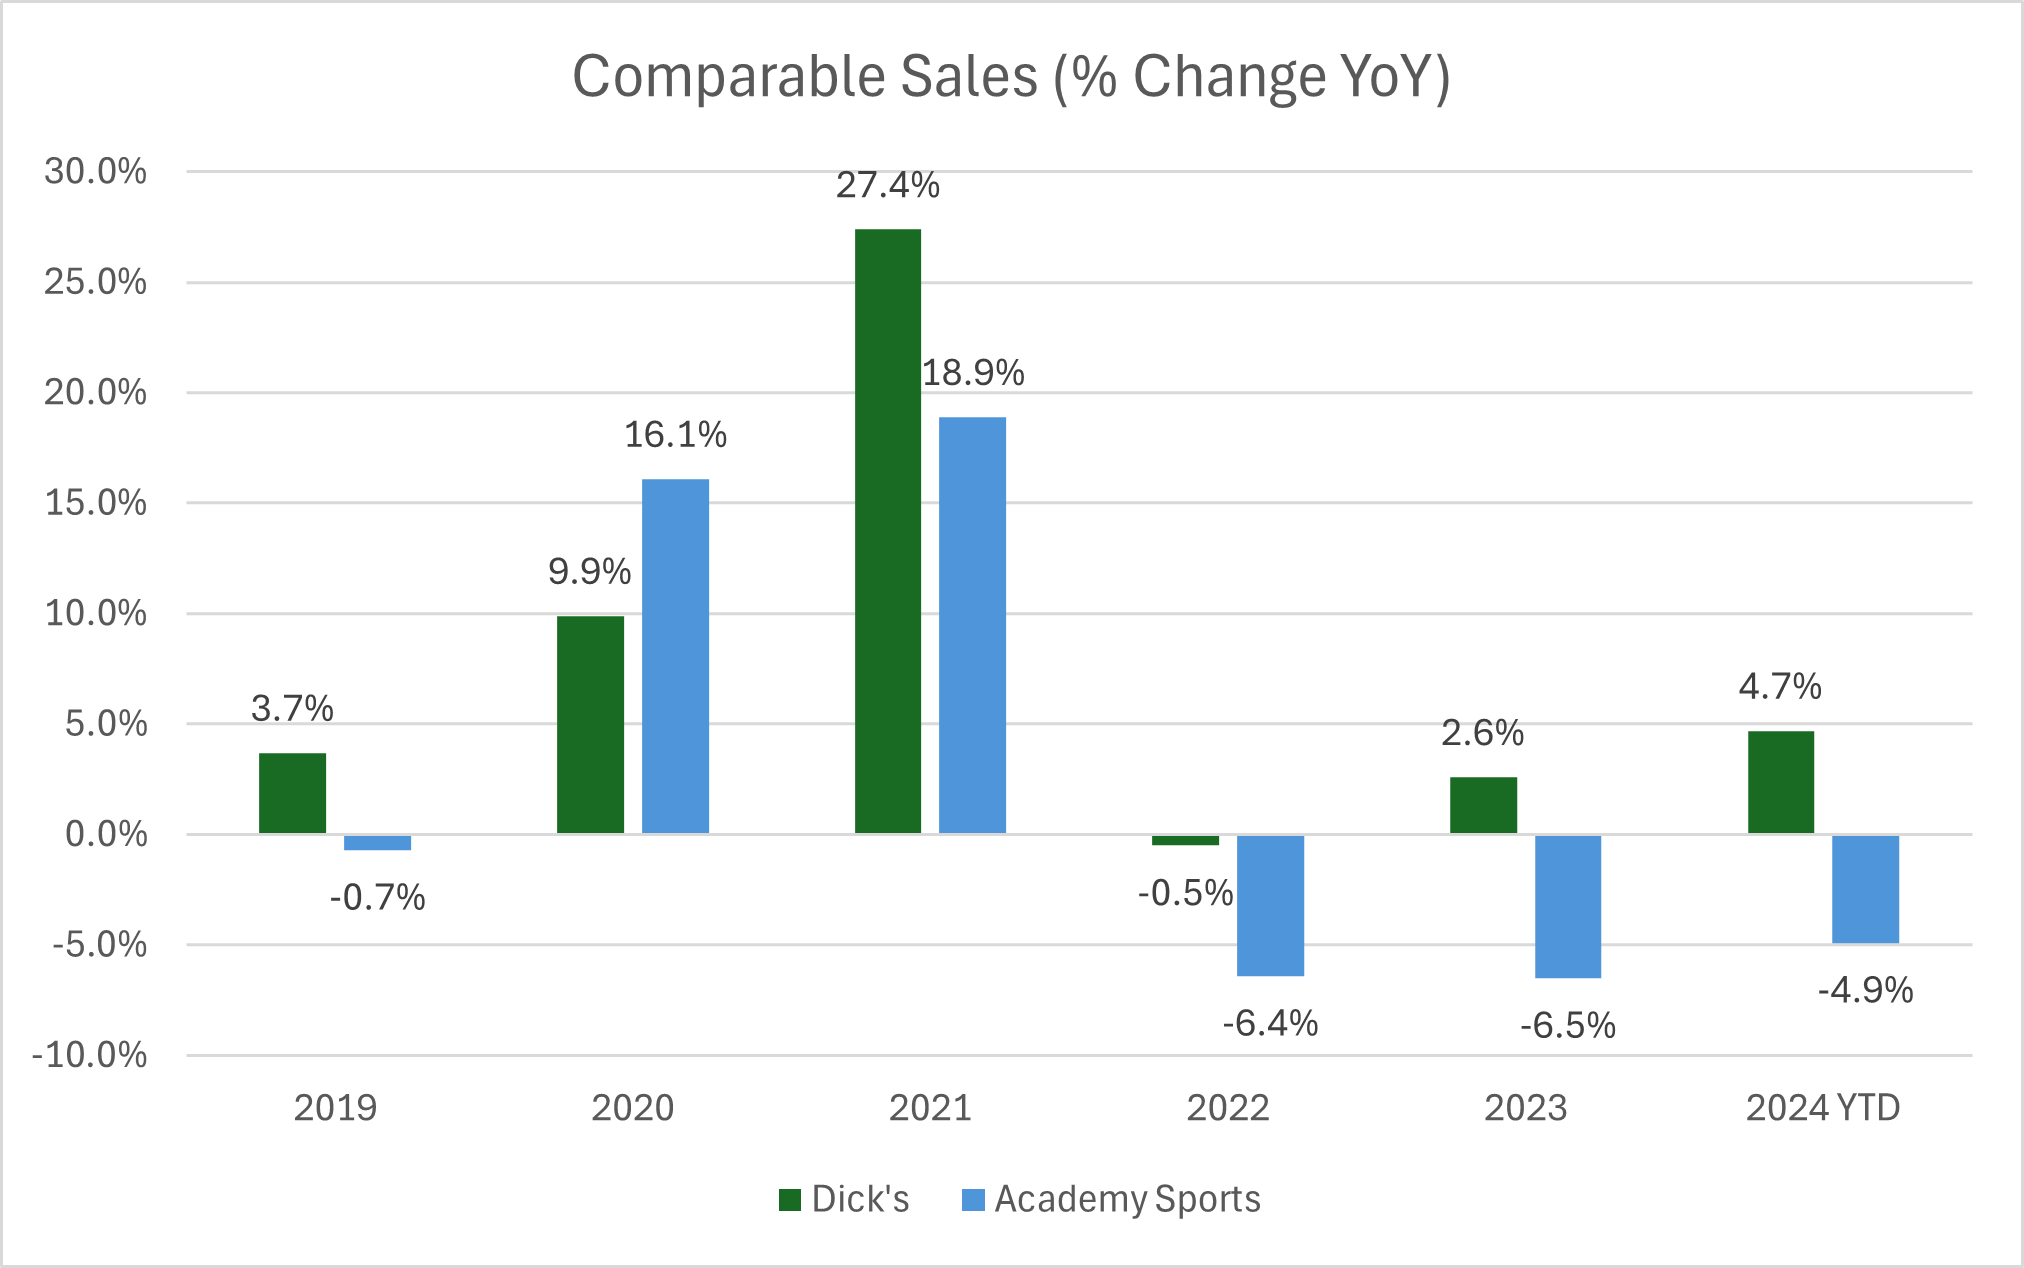
The chart above highlights a clear divergence between the two retailers:
ASO: Showed strong pandemic-era growth, peaking at 18.9% in 2021, fueled by heightened demand for outdoor and recreational products. However, ASO has faced 11 consecutive quarters of negative comparable sales growth, including a -4.9% decline YTD 2024, reflecting challenges in sustaining post-pandemic momentum.
DKS: Maintained steadier performance, with a peak growth rate of 27.4% in 2021. Notably, DKS achieved 4.7% YTD 2024 comparable sales growth, continuing its trend of modest but consistent positive performance.
This divergence underscores ASO’s reliance on pandemic-driven categories like hunting, fishing, and camping, which have normalized sharply. DKS’s product mix, including its focus on team sports and exclusive brands, has proven more resilient to shifting consumer spending patterns. Despite ASO’s weaker sales comps, both companies are seeing inflections higher.
Sales Per Square Foot (SPSF)
ASO currently reports SPSF of $313, compared to DKS at $304. While ASO retains a slight edge, the gap has narrowed significantly in recent quarters due to the sales disparity just mentioned.
DKS’s improvements are attributed to its store optimization strategies, including enhanced layouts, private-label expansion, and omnichannel improvements.
Operational Metrics and Store-Level ROI
ASO: Achieves EBITDA profitability in Year 1 for new store builds and a stabilized ROIC of 40% by Year 4–5. This reflects disciplined capital deployment and efficient store management.
DKS: Reports a more variable ROIC for new stores, ranging from 35–65%, depending on location and store format. Its Field House concept is a strategic response to underserved markets and ASO’s regional strength.
E-commerce and Omnichannel Platforms
Both companies excel in integrating e-commerce with their physical stores:
ASO: Fulfills approximately 75% of online orders through its stores, maximizing inventory utilization and reducing delivery costs.
DKS: Leads in e-commerce penetration and has invested significantly in digital platforms to enhance customer experience and retention.
Overall, while ASO grapples with demand normalization, DKS has maintained steady growth, driven by its diversified product offerings and strategic market positioning.
Geographic Footprint and Growth Opportunities
The geographic reach of a retailer is a crucial factor in determining its growth potential. ASO and DKS offer contrasting footprints that directly impact their market opportunities and expansion strategies.
Geographic Footprint