North American Construction Group: Building Value, One Ton at a Time
How North American Construction Group is building its future on strong fundamentals.
Investment Highlights
Strong Financial Growth: Revenue has grown at a 15.5% CAGR from 2019-2023, with guidance of $1.5 billion in 2025.
Strategic Diversification: The acquisition of MacKellar Group expanded NOA’s geographic footprint to Australia, diversified revenue across over 30 resource types, and improved year-round fleet utilization.
Compelling Valuation: NOA trades at a 7.2x NTM P/E, below peers, with potential for 32% upside from multiple expansion alone to a 9.5x P/E.
Operational Excellence: Consistent ROIC growth (12.5% in 2023) and in-house equipment maintenance save 30-50% on costs, enhancing margins and competitiveness.
Shareholder Alignment: Insider ownership of 11.4%, a disciplined capital allocation strategy, and minimal share dilution despite significant acquisitions.
Robust Backlog: $3.6 billion backlog provides ~2.4x annual revenue coverage, offering strong visibility into future earnings.
Introduction
North American Construction Group Ltd. (NOA) stands out as a leading provider of heavy equipment and mining services. With roots dating back to 1953, the company has developed a robust operational footprint across Canada, Australia, and the U.S., while leveraging expertise in heavy earthworks, mining services, and civil construction. This article evaluates NOA's competitive positioning, growth opportunities, risks, and financial outlook to assess its suitability for investment.
1. Company Overview
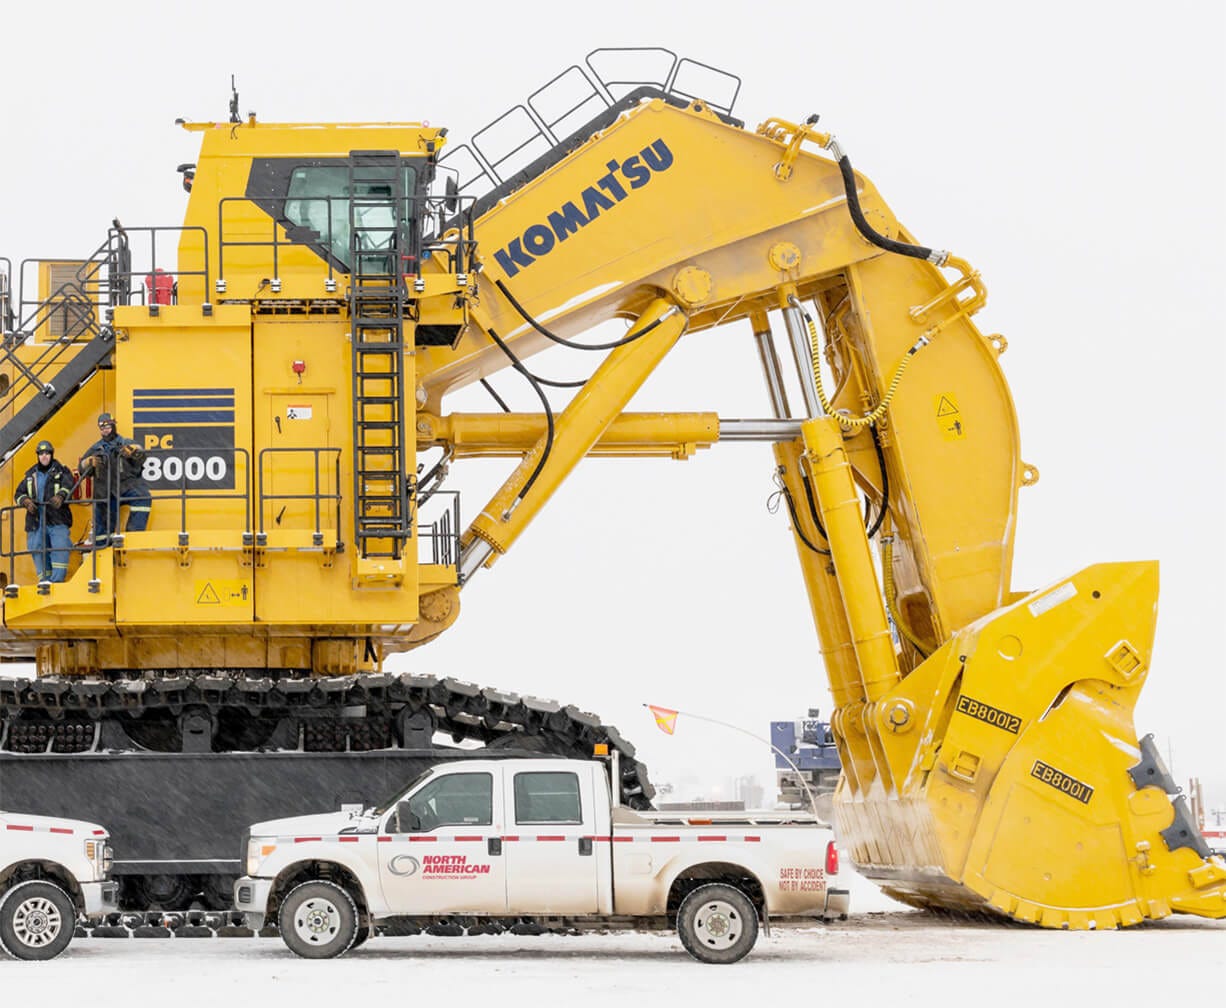
NOA specializes in providing equipment and services for resource development projects, particularly in the oil sands and mining industries. The company’s services range from equipment rental and earthworks to project management and civil construction. NOA’s operations are geographically diversified, with strongholds in Canada and growing market share in Australia due to the transformational acquisition of MacKellar Group.
NOTE: All figures below are CAD unless noted otherwise.
2. Industry and Competition
The mining and civil construction industry is defined by substantial capital intensity, exposure to cyclical demand, and stringent safety requirements, creating both opportunities and challenges for market participants.
Capital Intensity:
Fleet acquisition and maintenance represent significant barriers to entry. NOA’s fleet replacement cost of $3.5 billion underscores the capital required to compete effectively.
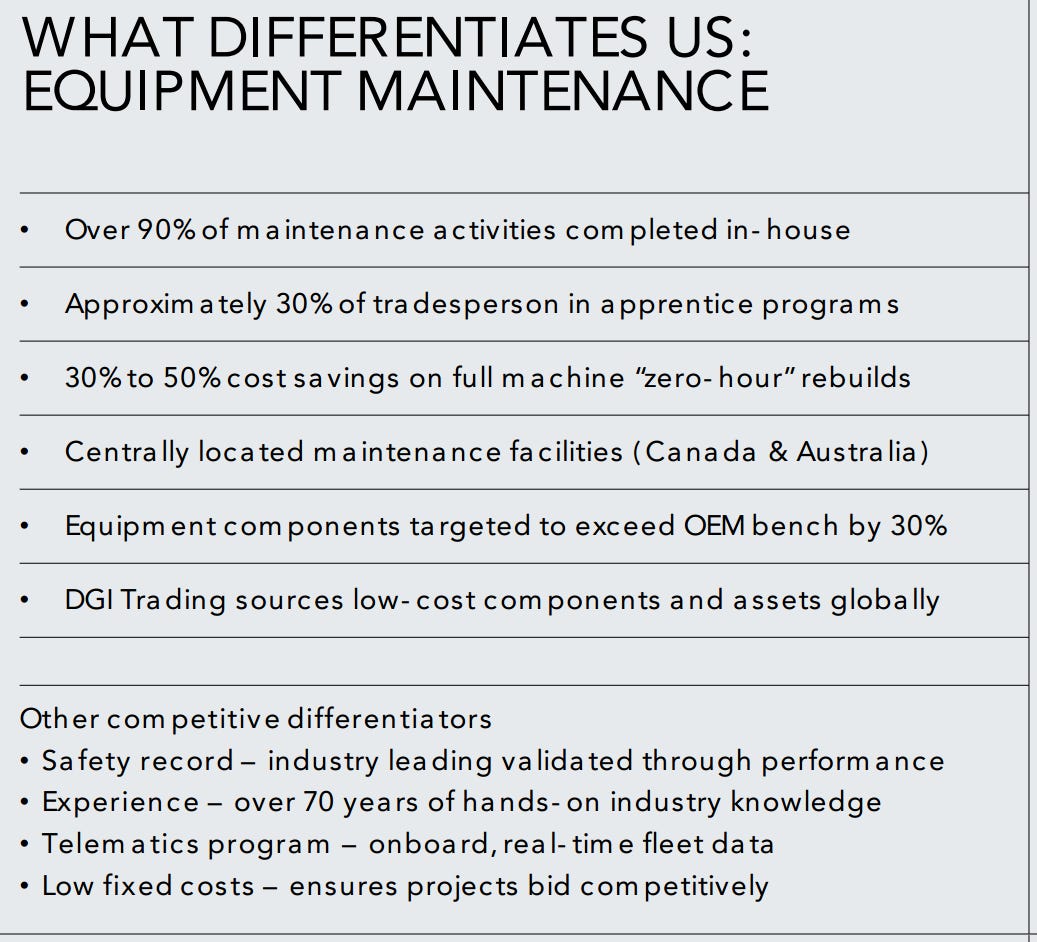
NOA’s in-house maintenance operations, handling 90% of repairs internally, provide a cost advantage, saving 30-50% compared to OEMs. This efficiency supports competitive bidding and long-term profitability.
Cyclicality:
Commodity price volatility and macroeconomic conditions heavily influence project demand. During downturns, delayed projects and reduced production volumes can compress revenues. Conversely, growth periods provide opportunities for well-capitalized operators like NOA to scale operations and secure contracts.
Geographic and commodity diversification, such as NOA’s entry into Australia, mitigate some of the cyclicality risks.
Safety Requirements:
Mining and construction operations involve harsh environmental conditions that demand rigorous safety protocols. NOA’s safety-first culture is validated by its strong performance record, making it a trusted contractor for blue-chip clients.
Compliance with stringent regulations, particularly in environmentally sensitive areas, differentiates well-established players like NOA from smaller, less-experienced competitors.
Core Competitors
NOA faces competition from Canadian, Australian and international players.
Notable competitors in Canada include:
Aecon Group Inc. (TSX: ARE): A leading construction and infrastructure company with a diversified portfolio spanning mining and energy projects.
Bird Construction Inc. (TSX: BDT): Focuses on civil construction and large-scale infrastructure, directly competing in mining-related projects.
CES Energy Solutions Corp. (TSX: CEU): Provides oilfield and energy solutions, overlapping with NOA’s energy-related services.
Wajax Corporation (TSX: WJX): Specializes in industrial equipment distribution and construction solutions across Canada. Also, a supplier to NOA.
Notable competitors in Australia include:
BUMA Australia (Delta Dunia Indonesia): A significant provider of mining services, particularly in Queensland and Western Australia. Competes directly with MacKellar in large-scale mining contracts.
Mader Group (ASX: MAD): Specializes in contract labor and maintenance services for heavy equipment, directly competing with MacKellar in equipment maintenance and support.
Alfabs (ASX: ALL): Diversified into equipment hire, engineering services, and manufacturing, serving similar industries as MacKellar. Its broad service portfolio overlaps with MacKellar’s operations.
Western Plant Hire: Previously acquired by MacKellar, this entity has a regional presence that complements MacKellar’s core business while also competing on specific scopes.
Global Positioning
NOA’s acquisition of MacKellar Group has expanded its competitive footprint into Australia, a resource-rich and mining-friendly region. This move diversifies its geographic exposure and reduces reliance on the Canadian oil sands. Key strategic advantages include:
Geographic Reach: Operations now span Alberta, Queensland, and Western Australia, providing access to high-value mining projects in stable jurisdictions.
Commodity Diversification: Exposure to metallurgical coal, thermal coal, gold, and iron ore complements the company’s core oil sands operations, balancing its revenue streams.
Year-Round Operations: MacKellar’s steady activity throughout the year enhances fleet utilization, with Australian operations targeting an 85% utilization rate compared to 75% in Canada.
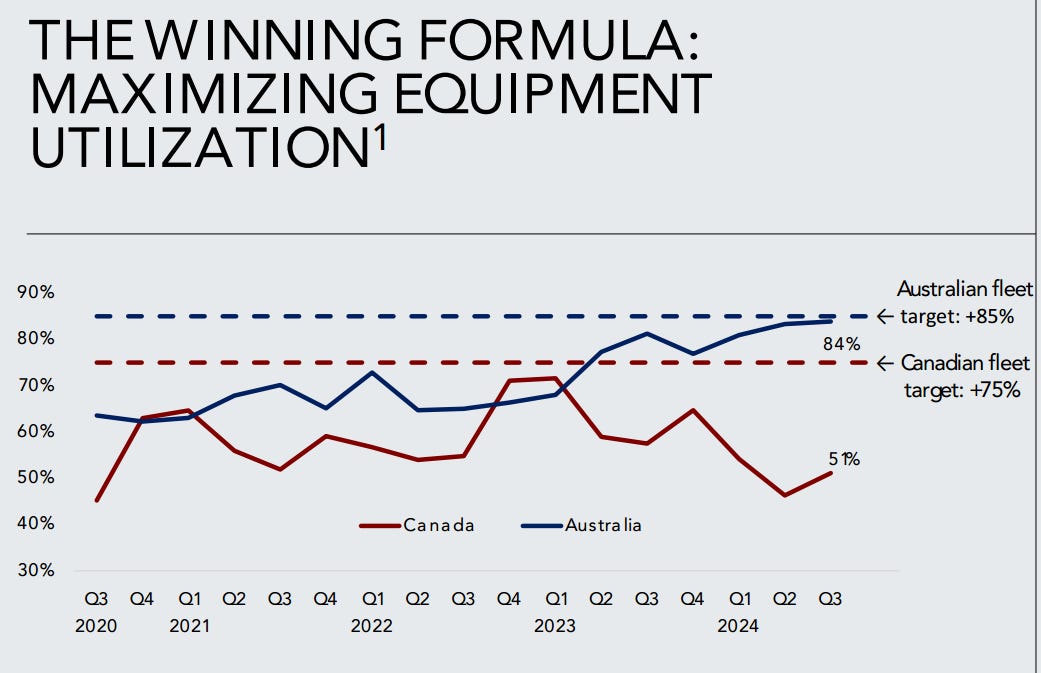
NOA's Canadian equipment utilization has fallen below the 75% target, primarily due to project completions, seasonal delays, shifting work scopes, and growing haul distances, with mitigation efforts focused on telematics, diversification, and strategic maintenance.
3. Competitive Advantages
Indigenous Partnerships:
NOA’s long-standing relationships with Indigenous partners in Canada enable it to secure contracts that mandate such collaborations. These partnerships also contribute to local employment and economic development. Mikisew and Nuna are the two most significant partnerships for the company, and the company owns a 49% interest in each of those JVs.
In-House Equipment Maintenance:
Over 90% of maintenance is completed in-house, delivering 30-50% cost savings compared to Original Equipment Manufacturer (OEM) rebuilds.
The company leverages telematics for real-time monitoring of over 375 units, improving uptime and lowering repair costs.
Barriers to Entry:
Fleet Acquisition: NOA’s fleet replacement cost exceeds $3.5 billion, deterring smaller competitors from scaling up.
Significant number of trucks larger than 240 tons in capacity providing a distinct advantage relating to a specialized skill base and equipment availability.
Operational Expertise: Decades of experience in harsh environments (e.g., Canadian oil sands) reinforce its reputation as a reliable contractor.
4. Management Profile
Insider Ownership:
NOA’s management demonstrates alignment with shareholders through significant insider ownership (11.4% of shares).
Martin Ferron (Chairman) has been with NOA since 2012 and holds 2.4 million shares or 8.6% of the company.
Joseph Lambert (CEO) has been with NOA since 2008, working his way up from GM of Mining, and owns 413k shares or 1.5% of the company.
Other remaining insiders own another 1.3% of shares.
Large Institutional Shareholders:
Mawer Investment Management, a sub-advisor for Manulife’s investments, reported an 11.16% ownership as of 9/30/2024, an increase from the prior quarter.
A few hedge funds and advisory firms (Claret, Cannell and Polar) own about 6-7% each of NOA shares. Polar Asset Management had increased its ownership by 60% during Q3.
Long-Term Incentive Plan (LTIP):
NOA’s LTIP ties executive rewards to shareholder returns via metrics like Total Shareholder Return (TSR), ROIC and free cash flow growth. I see this as a benefit showing good alignment with shareholder interests.
5. Business Segments Overview
Nuna Group and Mikisew JV:
These partnerships represent joint ventures specializing in project management and construction services for northern Canadian resource projects. Nuna has a strong reputation for Indigenous collaboration. Together these partnerships contribute about 30% of NOA revenue.
MacKellar Group:
The "Growth Engine" of NOA, MacKellar has diversified NOA’s revenue streams into metallurgical coal, thermal coal, and other commodities. It contributes significantly to NOA’s Australian operations, with utilization rates exceeding 85%. Since the MacKellar acquisition in October 2023, Australia now comprises just over 50% of NOA combined revenue.
Core Canadian and US Operations:
NOA remains the largest heavy equipment contractor in the Canadian oil sands.
6. MacKellar Acquisition Profile
NOA’s acquisition of MacKellar Group in October 2023 represents a pivotal step in its growth strategy, bringing significant operational and financial benefits. Key highlights include:
Acquisition Details:
Purchase price: CAD $369 million.
Valuation: ~2.55x EBITDA, 5.7x free cash flow, and 4.2x P/E multiple.
Operational Impact:
Doubled NOA’s contractual backlog to approximately $4 billion.
Enhanced commodity diversification with exposure to over 30 resource types, including metallurgical coal, thermal coal, iron ore, and gold.
Year-round Australian operations provide higher fleet utilization rates (~85%) compared to Canada (~75%).
This acquisition not only expands NOA’s geographic footprint and operational capabilities but also underscores its ability to execute strategic, value-enhancing deals at attractive valuations. By reducing reliance on the seasonal Canadian oil sands market, MacKellar positions NOA for more consistent growth and financial performance.
7. Capital Allocation
NOA utilizes credit facilities, equipment financing and convertible debentures for leverage. The company currently has a 2.1x net leverage ratio (Net Debt-to-EBITDA) on an LTM and NTM basis. This will come down as management targets a 1.8x ratio.
Convertible Debentures
NOA’s outstanding convertible debentures represent a strategic mix of debt and equity-like financing. The company’s two tranches of debentures mature in 2026 and 2028, offering attractive coupon rates of 5.00% and 5.50%, respectively. These instruments provide holders with the flexibility to convert into equity, which could result in some dilution if exercised, or to hold for steady income.
Balancing Share Repurchases and Dilution
NOA’s history demonstrates a strategic approach to managing dilution from convertible debentures while maintaining shareholder returns. For example, in 2020, the company redeemed 5.50% convertible debentures issued in 2017 by issuing 4,583,655 common shares. This action, while avoiding broader dilution, reflected the delicate balance between fulfilling debt obligations and managing equity dilution.
Recent activity, such as the announcement of a 2.1 million share NCIB, appears less about EPS accretion and more aligned with offsetting potential dilution from current debentures. This "tug-of-war" underscores the company’s commitment to disciplined capital management while navigating the competing pressures of shareholder returns and convertible debt.
Personally, I don’t view share repurchases by NOA as a growth driver at all. I prefer to have all 3 growth drivers working for me (buybacks, earnings growth and P/E expansion). NOA should maintain share count over time but don’t expect a reduction long-term.
Shares Outstanding and Adjusted EPS
I really admire management’s focus on ROIC, proper breakdown of free cash flow and comprehensive reporting. However, management excludes potentially dilutive shares from the convertible debentures in its Adjusted EPS figures - for historical and outlook purposes.
I believe this should be included in the reported EPS since these debentures are currently exercisable based on the conversion price. Granted the debentures will likely be held for the next few years for their yield but reporting the diluted share count will recognize the coming dilution.
Below you will notice the diluted share count of 33 million shares, which is 23% higher than the current common shares outstanding. Excluding the treasury share effect, I estimate the current diluted shares outstanding to be around 32.1 million.
8. Financial Performance and Trends
Five-Year Trend
North American Construction Group (NOA) has demonstrated strong financial performance over the past five years, driven by a combination of organic growth and strategic acquisitions. Revenue has grown significantly, rising from $715.1 million in 2019 to $1,273.6 million in 2023. This growth reflects NOA’s ability to secure new contracts, expand its geographic footprint, and integrate acquisitions like the MacKellar Group, which have added substantial backlog and diversified revenue streams.
Return on Invested Capital (ROIC) has also shown consistent improvement, increasing from 9.7% in 2019 to a peak of 13.0% in 2022 before normalizing slightly to 12.5% in 2023. This reflects management's disciplined approach to capital allocation and efficient deployment of resources. Management has strategically utilized net debt to fuel this growth, maintaining a net leverage range of 1.8-2.5x, which balances growth ambitions with financial stability. Despite several acquisitions, including the transformative MacKellar deal, NOA has largely maintained its share count, ensuring minimal dilution for shareholders.
Company Guidance
Looking ahead, NOA has issued guidance for a median $4.30 in adjusted EPS and $1.5 billion in revenue for 2025. These figures represent compound annual growth rates (CAGR) of 16.5% for adjusted EPS and 13.1% for revenue from 2019 levels, showcasing the company’s ongoing trajectory of strong growth and operational execution.
I am unsure the reason for the drop in analyst consensus EPS for FY 2024. There is quite a dispersion among the 6 analysts with a median of $3.41/share and a range between $2.45 and $3.97. The company, however, issued guidance of $3.95-4.15. Regarding the valuation section below, if the company meets its 2024 guidance this may drive the P/E ratio back in line with peers.
Valuation
Given the capital-intensive nature of this business, it deserves a lower relative multiple than most other industries. However, the NTM P/E of 7.2x I believe is too low and warrants consideration for investment as it also lags its Canadian peers in valuation.
Certainly, one of the factors that contributed to a depressed valuation during much of 2024 was the uncertainty whether management would turn around the Nuna Group JV back to profit. CEO Joseph Lambert provided encouraging commentary on this in the last quarter’s letter to shareholders:
“Our Nuna partnership also performed as planned in the quarter with a modest but meaningful profit. Year-on-year Nuna has far improved from the wildfire impacts and poor project performance of last year. We remain confident in the turn-around in our Nuna business and our ability to grow it profitably moving forward.”
Though earlier I mentioned including the dilutive effect of the debentures in the share count for an alternative consideration, I am valuing this company on its current count of 26.8 million shares since it has maintained that count for the last 5 years with periodic share repurchase programs to manage dilution.
A simple normalization alongside peers to a 9.5x PE ratio gives this stock 32% upside alone. Buying lower relative valuation is one of the three drivers of long-term growth I focus on.
I own a position in NOA (NYSE shares) at about 50 basis points of my portfolio. I acquired these at an average cost basis (in USD) of $18.00 a share. I may consider adding to the position but am currently evaluating this in relation to some other positions.
Free Cash Flow
Finally, this company currently yields 16.7% FCF on market cap after backing out any growth capex. It may seem high for such a capital-intensive company but there is one thing to keep in mind.
NOA has a Cash Conversion Cycle (CCC) of nearly 0 days. It manages its receivables and payables well. This excludes any inventory, and its overall working capital intensity is rather low at around 6%. Most of its capital is tied up in its equipment and some parts for repairs.
8. Risks
Operational Risks:
Equipment Utilization: Underutilized or unavailable equipment due to downtime or maintenance issues can significantly impact NOA’s profitability.
Availability of Skilled Labor: Labor shortages, especially for remote projects, inflate costs and delay operations, posing a challenge to maintaining an adequate workforce.
Capital Intensity: Ongoing maintenance and fleet replacement require substantial investment.
Market Risks:
Cyclicality: Commodity prices and demand fluctuations may affect project volumes.
Customer Insourcing: Clients opting to perform heavy construction and mining services in-house could reduce demand for NOA’s outsourced solutions.
Concentration Risks:
High reliance on top customers (e.g., 79% of revenue from four clients).
Geographic reliance on Canadian and Australian markets.
Contractual Risks:
Cost overrun exposure on fixed unit-price contracts.
Regulatory and environmental compliance risks in mining and oil sands.
Conclusion
North American Construction Group presents a compelling case for investment, balancing strong operational performance with prudent financial management. The company has successfully grown its revenue and expanded geographically through strategic acquisitions like the MacKellar Group, which has diversified its revenue base and improved fleet utilization. With consistent improvement in Return on Invested Capital and an ability to maintain its share count despite acquisitions, NOA demonstrates disciplined capital allocation aligned with shareholder interests.
The company's guidance for $4.30 adjusted EPS and $1.5 billion in revenue for 2025 reflects robust growth prospects, with CAGRs of 16.5% and 13.1%, respectively, from 2019. Despite its capital-intensive nature, NOA’s valuation at an NTM P/E of 7.2x appears overly conservative compared to its peers, highlighting potential upside. A normalization to 9.5x P/E could yield a 32% price appreciation, making NOA an attractive candidate for value-oriented investors.
However, risks remain, including exposure to cyclical commodity markets, customer concentration, and labor shortages. These factors warrant close monitoring, particularly as NOA navigates its growth in Australia and balances its capital-intensive operations. For investors seeking companies with tangible asset backing, strategic growth drivers, and undervalued earnings potential, NOA offers a unique opportunity.
Thanks for being part of the Safe Harbor community! Follow me for more insights: LinkedIn | X (formerly Twitter) | Instagram
Disclosure: This information is provided for informational purposes only and should not be considered a solicitation or recommendation to buy or sell any securities. The author or entity providing this information may hold positions in the securities discussed. This is not investment advice.
Nice write-up, enjoyed reading it.